

Don't blame Biden for inflation: Part 1
Don't blame Biden for inflation: Part 1
Econ 101 time!

Joe Biden is behind in the polls to Donald Trump, significantly if not overwhelmingly. This is alarming. I have confidence that Biden can pull things back, but I’m getting worried. Biden’s approval numbers are VERY low. I struggle to understand why. I think Biden has been a fantastic president. The majority of Americans disagree with me. I am substantially confused about why. Ok, the Republicans are always going to hate him; fine, that’s baked in. But what about the Democrats and independents? Why are they so lukewarm? There are a lot of reasons (most of which I disagree with), but one has been at the top of the issue polls for a long time: inflation! Inflation has been high, and PEOPLE HATE IT. And because Biden is president, they blame Biden.
I understand not liking inflation. It sucks. But I think Biden’s policies regarding inflation have been extraordinarily good. Unprecedentedly good, perhaps. The common allegation against Biden is that he spent too much on COVID stimulus (or really Congress did, but at Biden’s urging), and that caused inflation. There’s a grain of truth to that, but only a grain. And the larger picture is VASTLY more favorable to Biden’s handling of the economy. Or so I will argue.
This post started to get REALLY long, so I decided to break this into two parts. In this part, I’ll introduce a bit of basic economic theory so you can understand the challenges that Biden faced. In a second part (which I’ll post tomorrow), I’ll talk about why I think Biden responded correctly given the facts on the ground.
(My qualifications? I majored in economics in undergrad, and have maintained an avid interest in the subject ever since. So, ok, I’m not a guru. But understanding the basic shape of the problem, and the rationale for Biden’s response to that problem, doesn’t take an advanced degree. This is actually Econ 101 stuff. So let’s go!)
Let’s take this back to basics. The foundation of pretty much all of economics is the supply and demand curves. Econ textbooks are filled with pictures that look like this:

A deceptively simple graph. Let’s break down what this says, because it’s important. This graph charts quantity on the x axis against price on the y axis. There are two curves here, a supply curve and a demand curve. The supply curve is upward sloping: this means that, if you’re a supplier of some good, the higher the price for that good, the more you’ll want to supply. The demand curve is downward sloping: this means that, if you’re a buyer of some good, the higher the price for that good, the less you’ll want to buy. Obviously.
These two curves intersect at an equilibrium point. This equilibrium is stable. If the price level falls below the equilibrium point, demand will be greater than supply. (Draw a horizontal line below the equilibrium point, and look at where it intersects both the supply and demand curves). This means there will be shortages, the price will get bid up, supply will increase and demand will decrease, and we’ll hit the equilibrium point. If the price level rises above the equilibrium, supply will be greater than demand. (Draw a horizontal line above the equilibrium point, and look at where it intersects both the supply and demand curves). This means there will be excess, sellers will lower the price to clear out inventory, supply will fall and demand will increase, and we’ll hit the equilibrium point.
The implication is that, in a market economy, the price and quantity of a good produced is always going to be at the equilibrium point of those two curves. Prices and quantities do move around all the time, but that’s because various forces change the shape of those curves, which causes the equilibrium point to move around. But price and quantity always return to an equilibrium point in short order; it’s just a shifting equilibrium.
So far I’ve been assuming that we’re just talking about the market for one good, widgets or whatever. But we can aggregate the supply and demand curves for the whole economy. Instead of the quantity of widgets, we’re looking at the quantity of EVERYTHING produced in the economy. That’s GDP. So we put GDP on the x axis. And instead of the price of widgets, we’re looking at the price of EVERYTHING produced in the economy. That’s the price level of the economy.
When we’re dealing with the economy as a whole, these changes in price and quantity take on newsworthy significance. The quantity, GDP, is the economy as a whole. When GDP goes up, we have economic expansion. When GDP goes down, that’s a recession. Similarly for the price level. When the price level goes up, that’s inflation. When the price level goes down, that’s deflation.
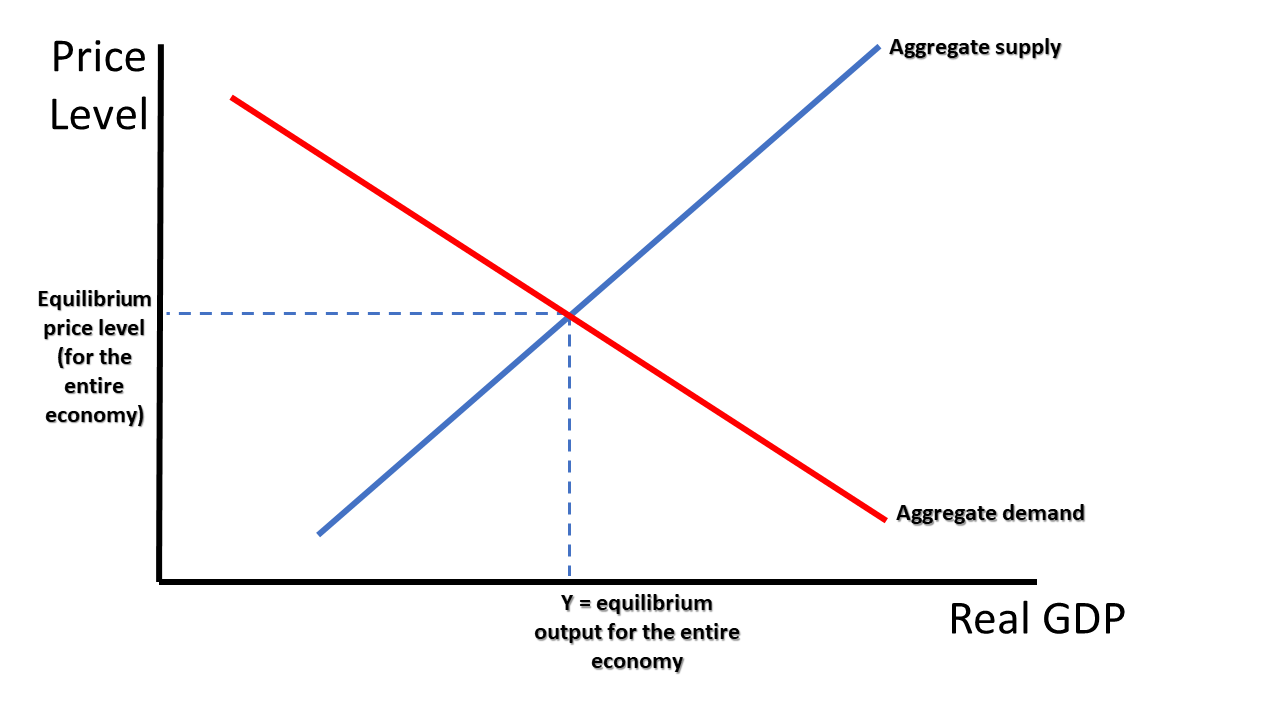
Although we’re aggregating, the same logic applies. We have a stable equilibrium of output and price for the economy as a whole. This aggregated picture smooths out a lot of important detail, but from the country-wide perspective, this is a useful way to think about things. This is how macroeconomists think.
The economic ideal is a growing economy with low inflation. Where the economy will be is always at the equilibrium point. So to get a growing economy with low inflation, what do we need to do? (Look at the graph and try to work it out for yourself for a moment.)
…
Ok?
…
Alright, what we need to do is shift both the aggregate supply and aggregate demand curve to the right. That means that people are willing to spend more at any given price level, and producers are willing to produce more at any given price level.
The shape of the supply curve is determined by things like the costs of raw materials and technologies available for efficiently turning those raw materials into finished goods. The shape of the demand curve is determined by things like the propensity to spend and the employment rate. A growing economy is one where technology drives gains in efficiency, pushing the supply curve to the right. These gains to efficiency lead to increased wages for workers, which then pushes the demand curve to the right a comparable amount. Steady GDP growth with minimal deviation in the price level! It’s a beautiful thing.
An important point to keep in mind is that, from a policy perspective, the government has a LOT of control over the shape of the demand curve. The government can spend more (or less) money, which pushes the demand curve to the right (the government is a buyer, not a supplier, for most goods). This is known as “fiscal policy.” And it can lower (or raise) interest rates, which will cause people to save less (or more) and thus spend more (or less). This is known as “monetary policy.” But it’s a bad idea for the government to just step on the gas, spend money and lower interest rates, push out the demand curve and raise GDP. Because if you push out the demand curve faster than the supply curve, you get inflation. It’s a delicate balance. What this means is that, if the government is doing it’s job right with both fiscal and monetary policy, they are always juicing or reigning in the aggregate demand curve to keep inflation low, whatever the supply curve happens to be doing.
This means that overall economic conditions are really driven by that supply curve. If the supply curve is pushing to the right, we’ve got lots of good choices to make. Efficiency is going up, GDP is going up, and all that the government has to do is keep prices steady so that the rising tide lifts all boats.
When the supply curve shifts to the LEFT, on the other hand, things are bad. There are no good options. Here’s what that looks like:

As you can see, a negative supply shock moves us from the old equilibrium A to the new equilibrium B. Lower GDP, higher prices. Recession and inflation at the same time. “Stagflation.” This really sucks. The textbook example of this was the oil crisis in the 1970s. OPEC cut oil production, spiking the price of oil, which is a raw material input to basically everything in the economy. As I said above, the shape of the demand curve is determined by the price of raw materials, and energy (oil) is a raw material input to everything. The oil embargo had the effect of pulling in the supply curve, kicking off a massive bout of inflation in an economy that was already somewhat overstimulated while sending the economy into a recession at the same time.
And if you’re the government in this situation, what do you do? You have control over the demand curve, you can push it to the left or right. But neither of those is a good option. Push the demand curve left and you get prices under control, but hurt the economy even more. Huge recession. Push the demand curve right and you can avert a recession, but at a cost of major inflation. Supply shocks suck. They are to be avoided at all costs.
In 2021 and 2022, the world got a double-whammy of bad economic news. COVID, then Russia’s invasion of Ukraine. COVID caused both a negative supply shock and a negative demand shock, as businesses were less able to produce and consumers were less able to consume due to lockdowns, both government-imposed and self-imposed. And the invasion of Ukraine caused massive disruptions to the economies of both countries. Russia is a major energy exporter, and Ukraine a major food exporter. Lack of availability of these foundational goods constituted a sharp negative supply shock. The thing you want to avoid at all costs happened. Sometimes life’s like that.
So, if you’re the government, what do you do?
Think about that for yourself. I’ll see you tomorrow.